Компания
Fundraise Up
Год
2024 – 2025
Тип
B2B
Обзор
Evolving analytics from simple reporting into a growth engine. We moved from a single chart to an ecosystem of 20+ metrics and implemented mechanics that highlight missed revenue opportunities.
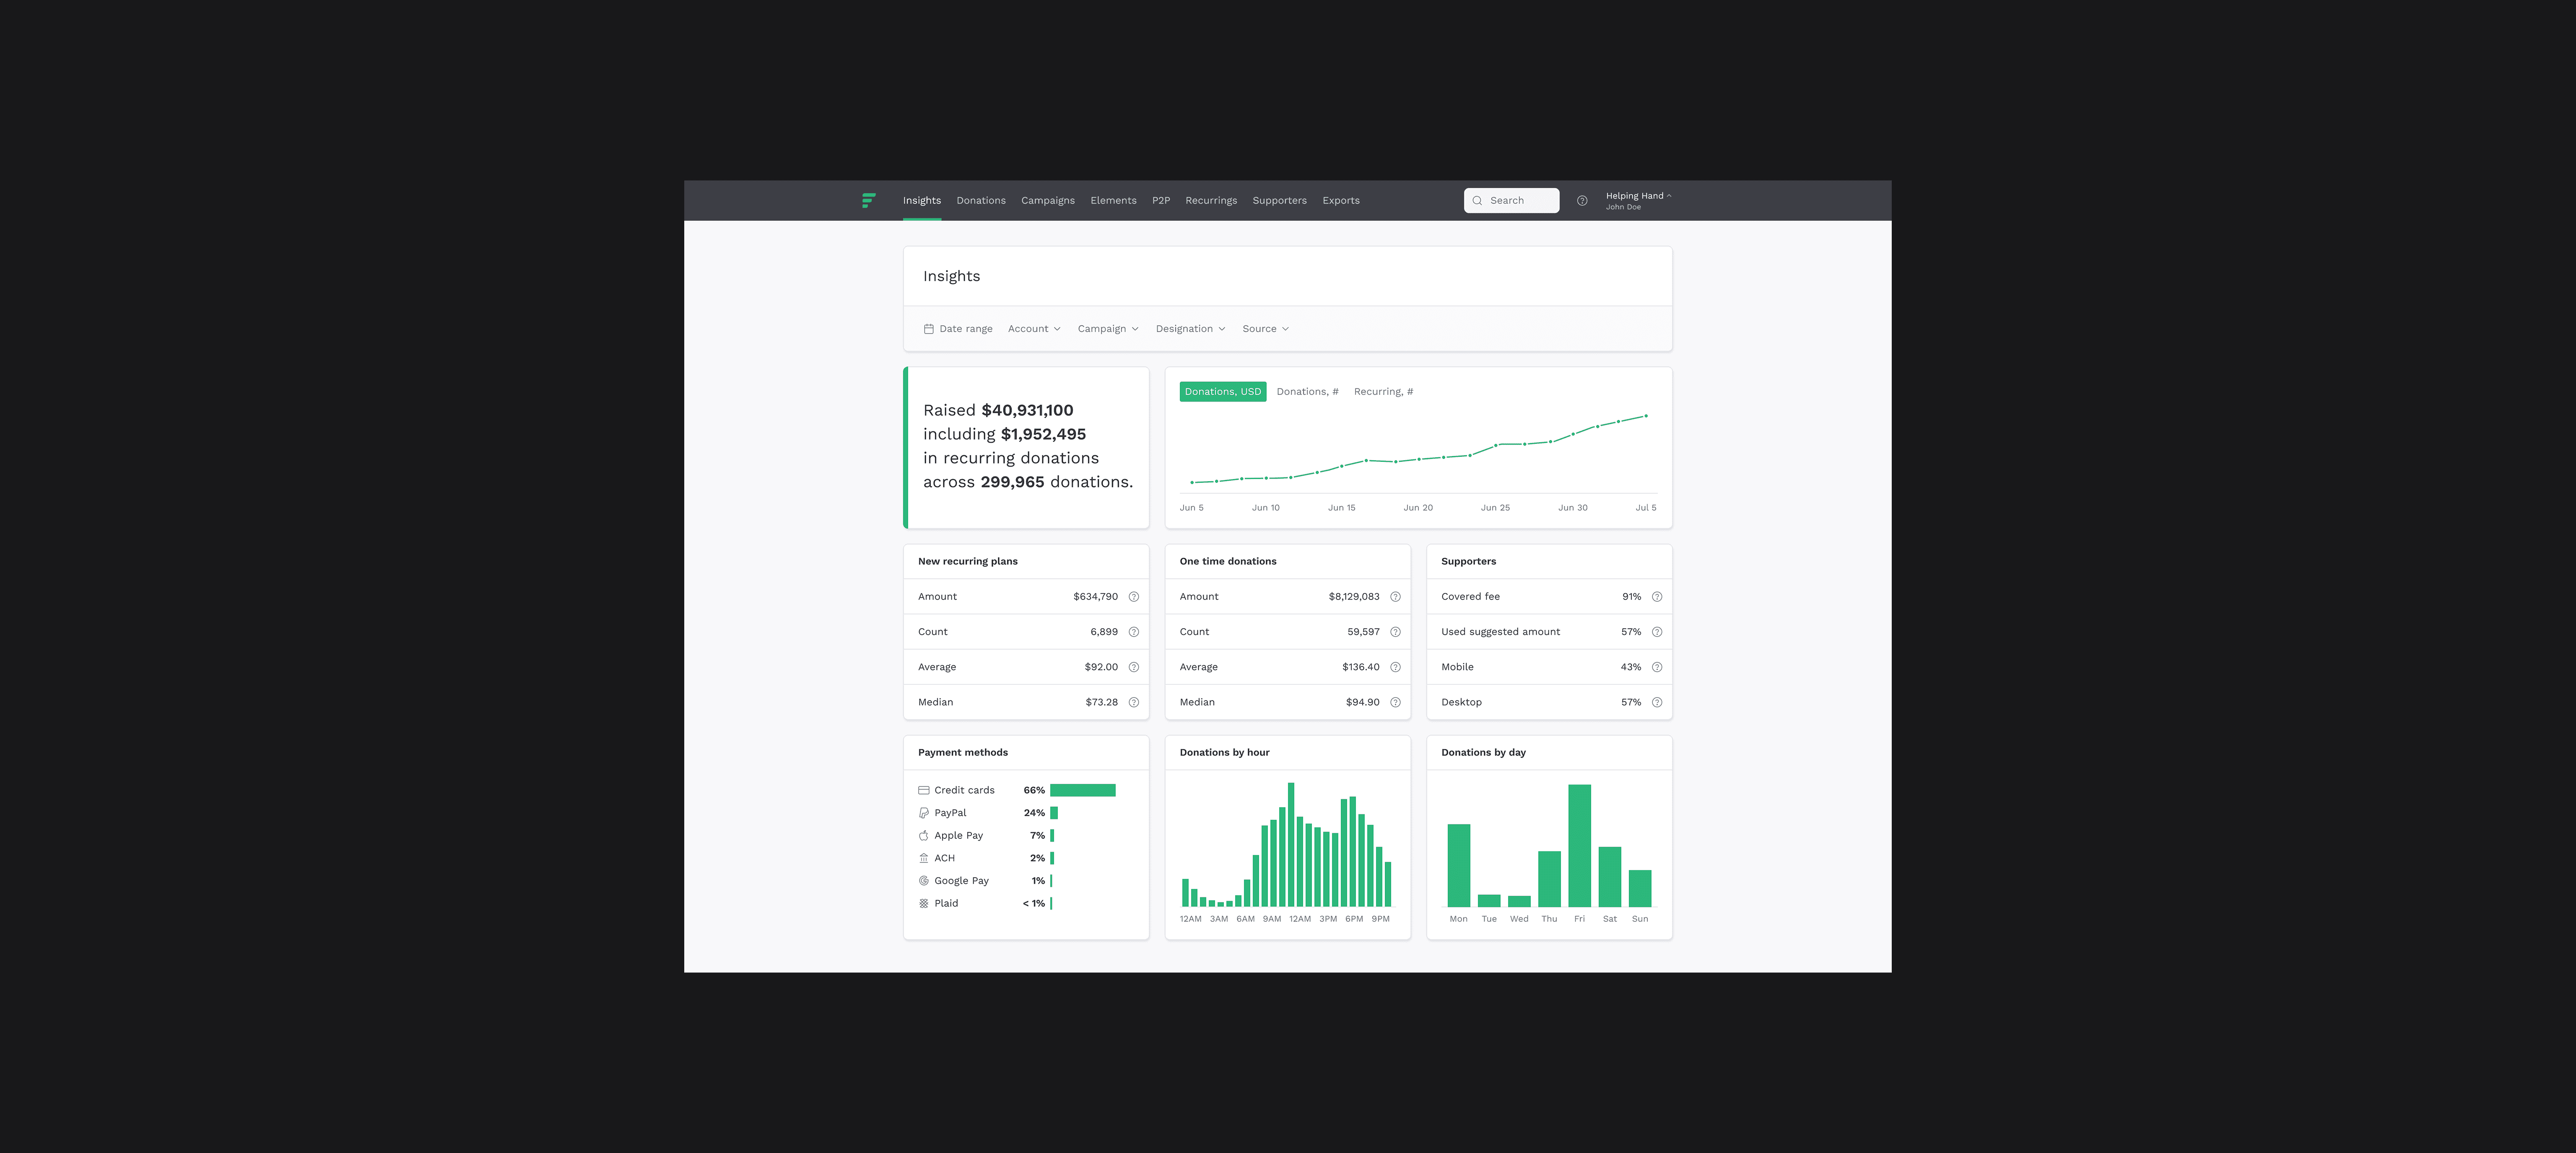
До редизайна
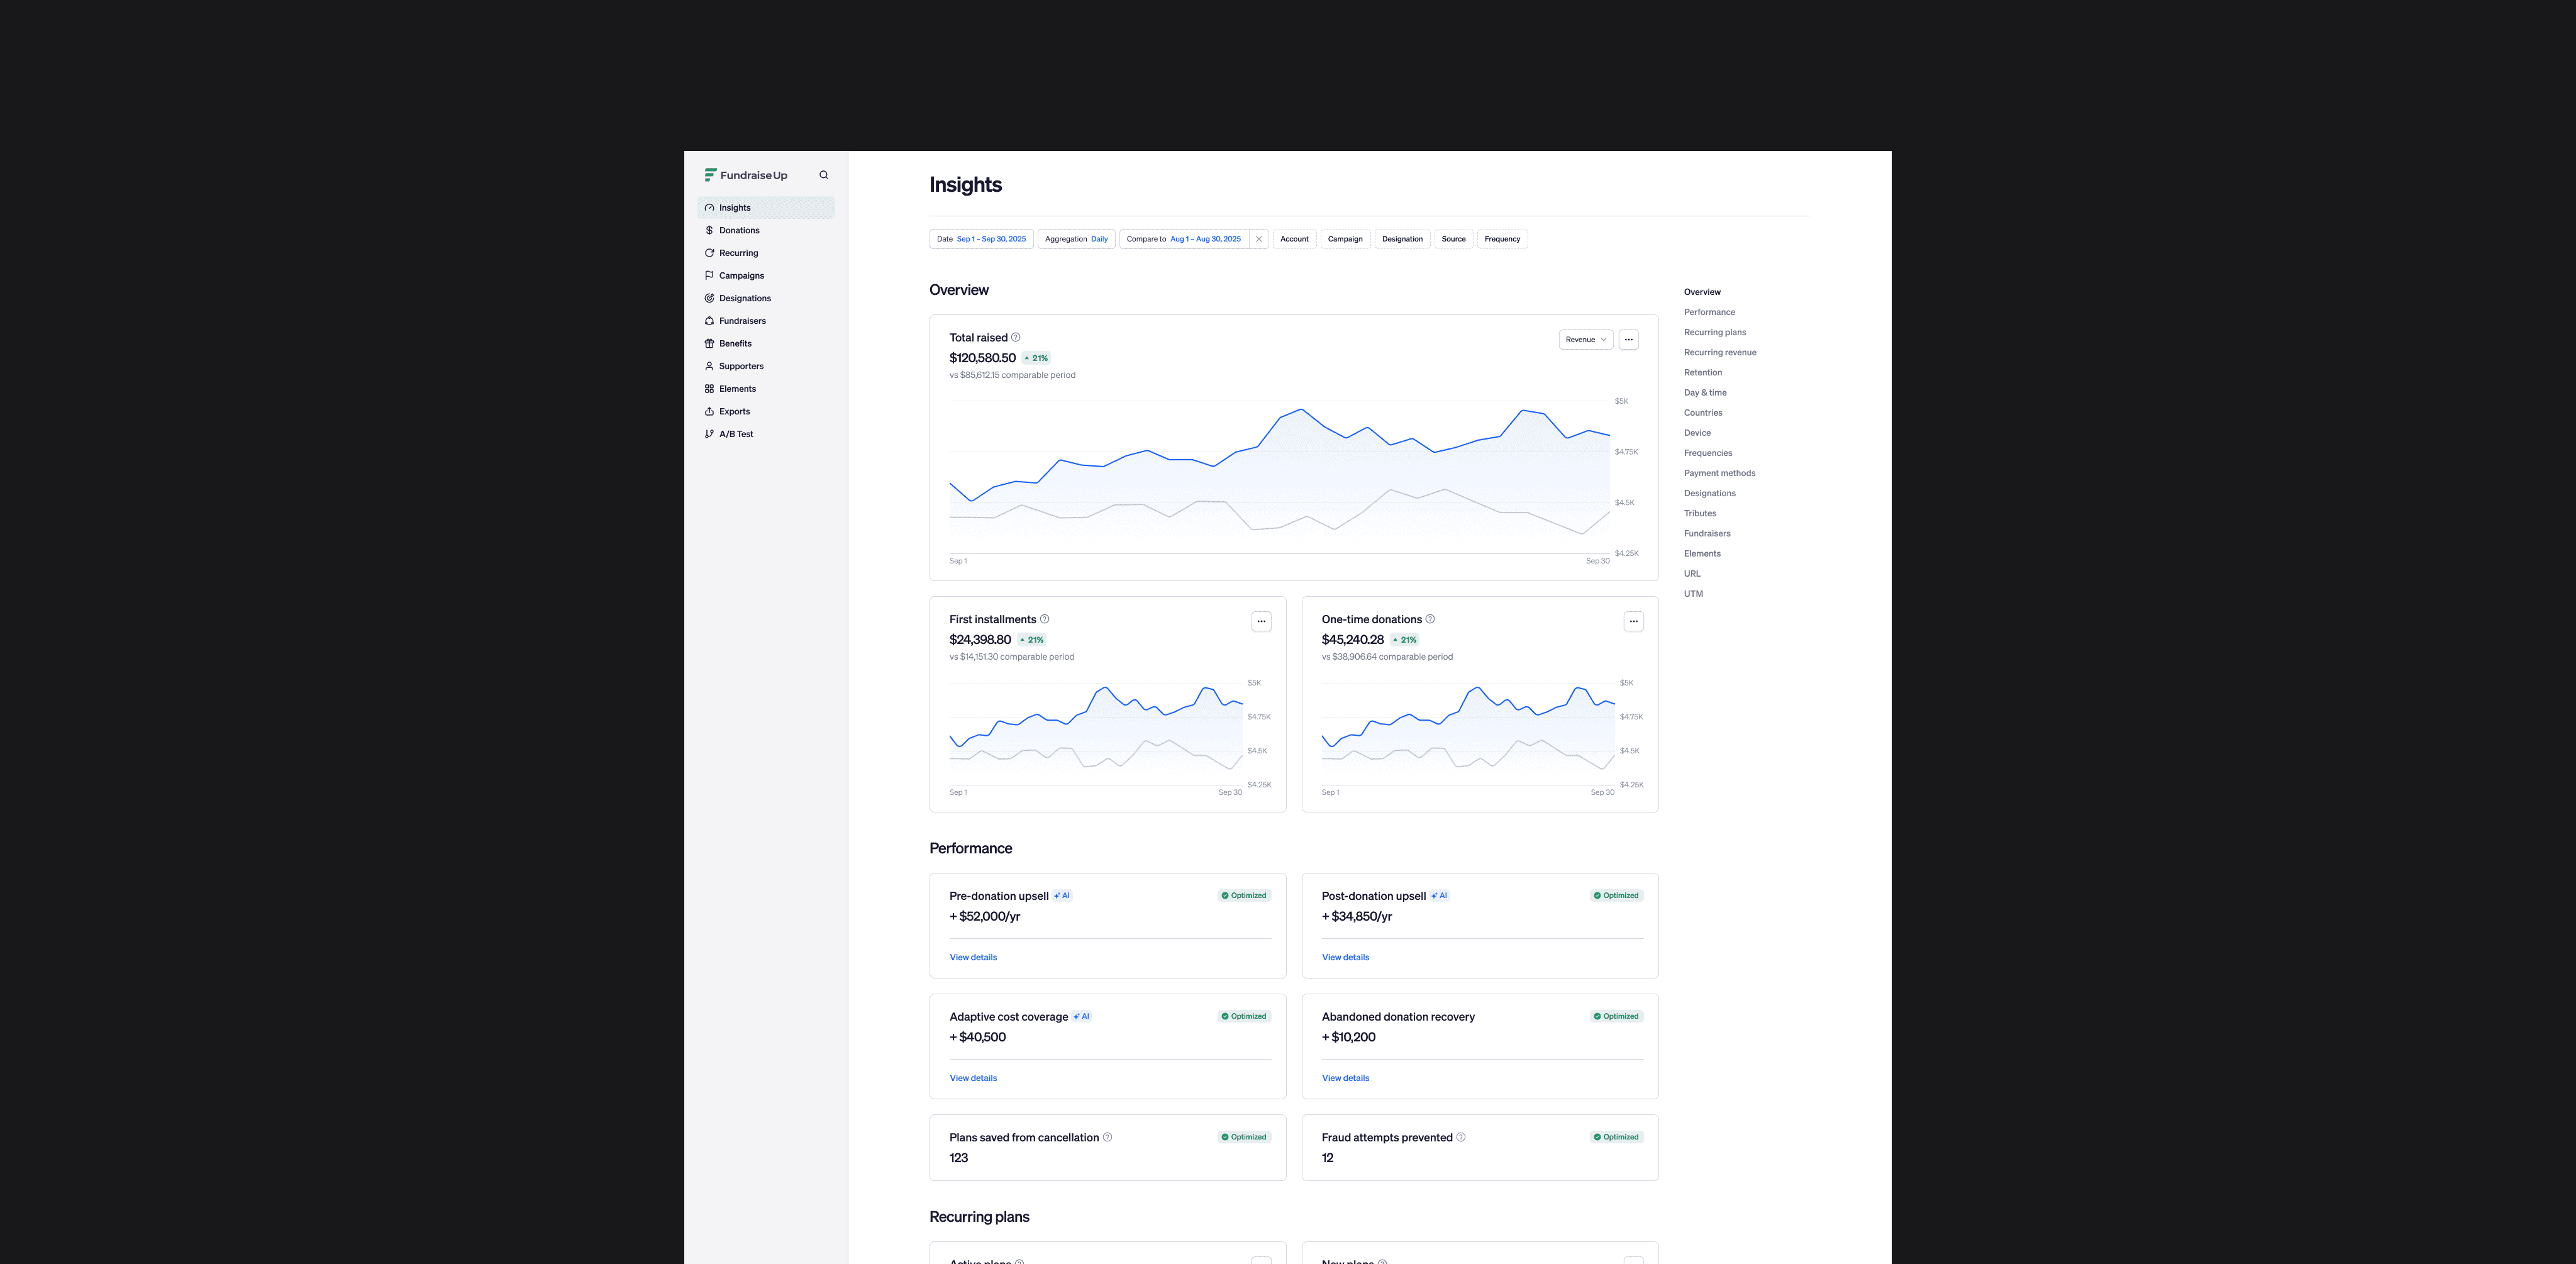
После редизайна
Проблема
The legacy dashboard was too primitive for enterprise clients, featuring only one chart and a list of static metrics. The lack of data depth, filtering, and granularity prevented nonprofits from analyzing campaign performance and making informed decisions.
Моя роль
Lead Designer. I led the complete redesign (Insights 2.0), created the data visualization design system, and designed new growth mechanics (Dashboard Growth).
Evolution of Approach
A shift from a Reporting model (stating facts) to Actionable Insights (driving action). We didn't just provide more data; we structured it so users could immediately identify growth opportunities.

Результат
New Data Suite: Designed and launched over 20 new charts (Retention, Recurring, UTM/URL, Payments), transforming the page into a full-fledged BI tool.
Raised Chart Revamp: Resolved a major user pain point by splitting the general fundraising chart into clear components (Total, First Installment, One-time), ensuring data transparency.
Performance Block (Upsell): Designed a block displaying feature status (Enabled/Disabled) and effectiveness. "Missed Opportunity" statuses motivate users to enable AI tools to boost revenue.
Elements Analytics: Added widget analytics, providing clients with a complete picture of conversion for every on-site element.
Процесс работы
Systematization: Developed a unified visual language for charts (colors, axes, tooltips) to ensure instant data readability.
Growth Experiments: Currently focusing on monetization metrics—driving the adoption of paid features through the analytics interface.